[1]:
import warnings
warnings.filterwarnings("ignore")
load Visium data using pysodb
[2]:
import pysodb
sodb = pysodb.SODB()
[3]:
dataset_name = '10x'
experiment_name = 'V1_Mouse_Brain_Sagittal_Posterior_filtered_feature_bc_matrix'
adata = sodb.load_experiment(dataset_name,experiment_name)
load experiment: V1_Mouse_Brain_Sagittal_Posterior_filtered_feature_bc_matrix in dataset: 10x
plot SOView for Visium data
[4]:
import SOView
scanpy==1.9.1 anndata==0.8.0 umap==0.5.2 numpy==1.22.4 scipy==1.7.3 pandas==1.5.2 scikit-learn==1.0.2 statsmodels==0.13.5 python-igraph==0.10.2 pynndescent==0.5.8
squidpy==1.1.2
[5]:
SOView.SOViewer_plot(
    adata = adata, # the data to plot
    save = None, # save the result to specified path or don't save (None)
    embedding_use='X_umap', # which embedding to be used for plot
    dot_size=10, # the marker size of the plot
    marker = 'o' # marker style


)

# SOView function gets results of both CIELAB and RGB color coding
generating color coding...
1.0 0.0
1.0 0.0
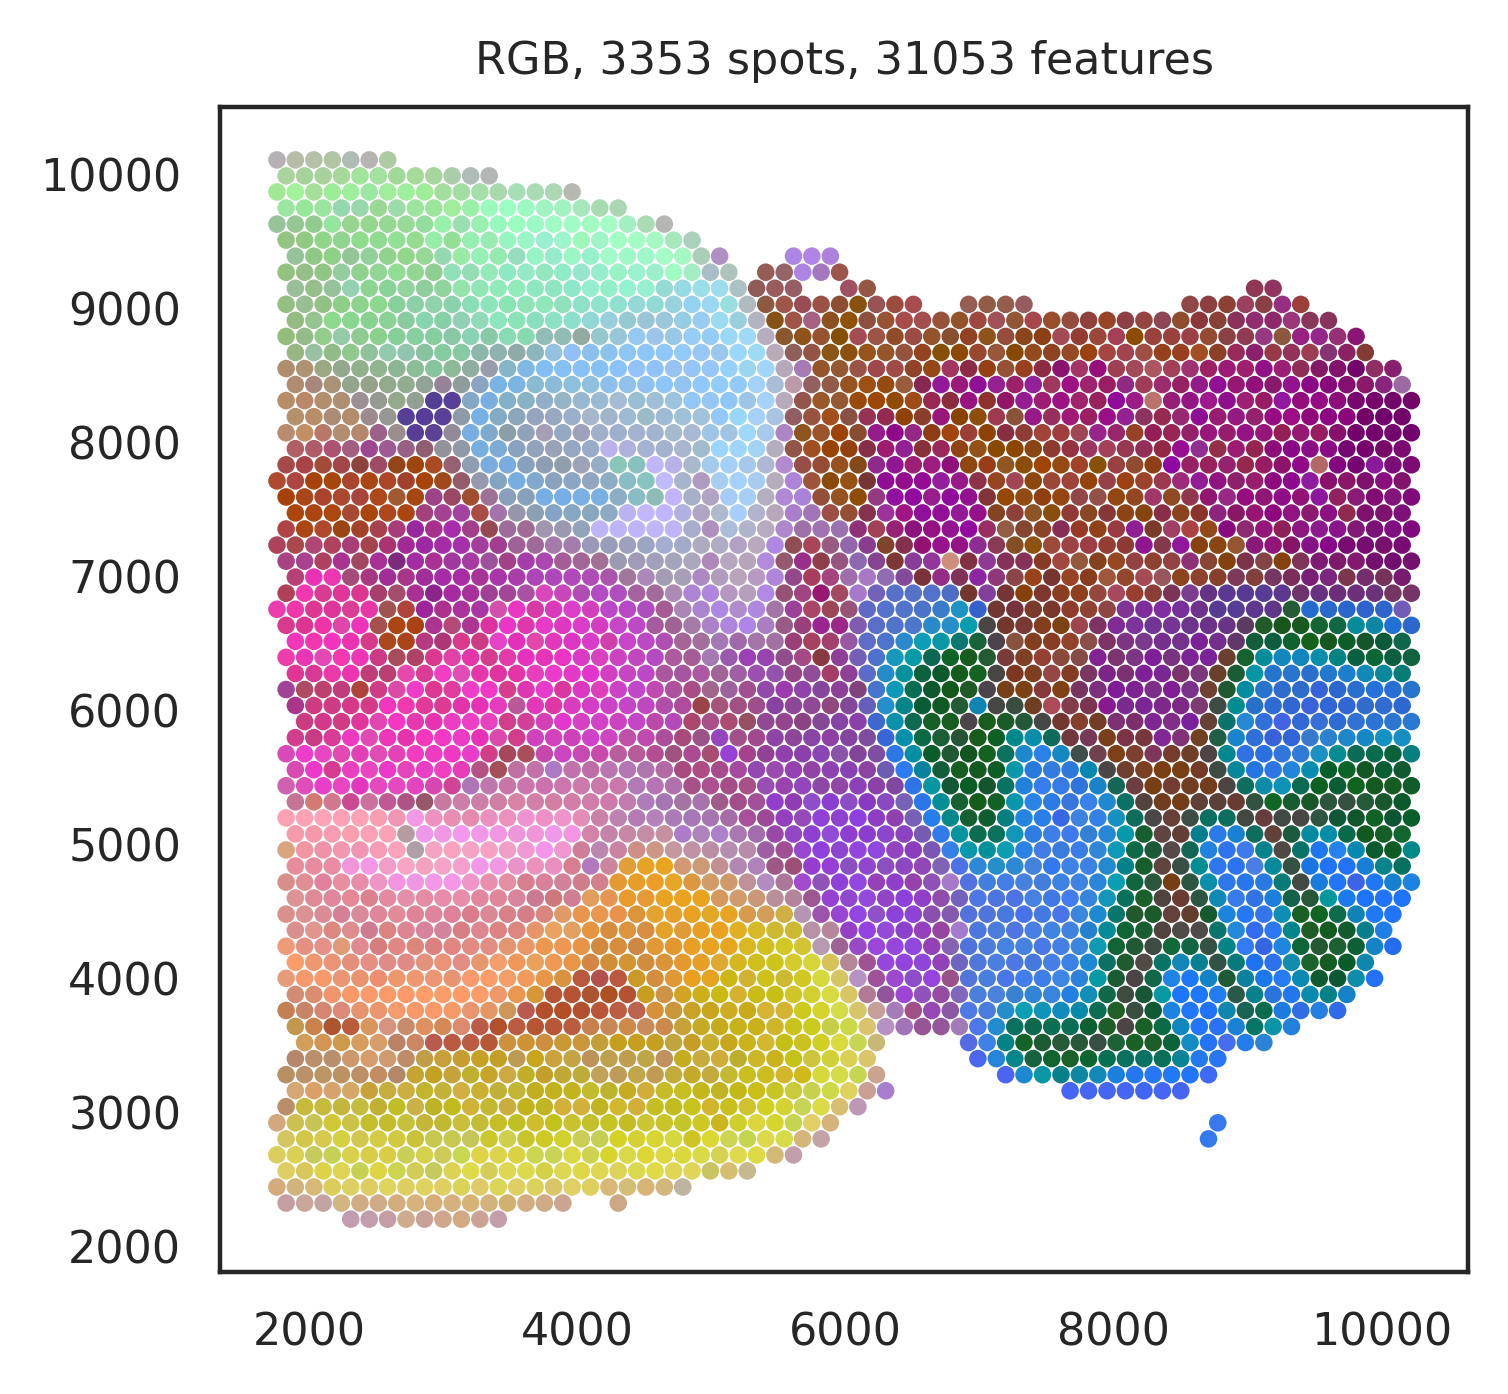
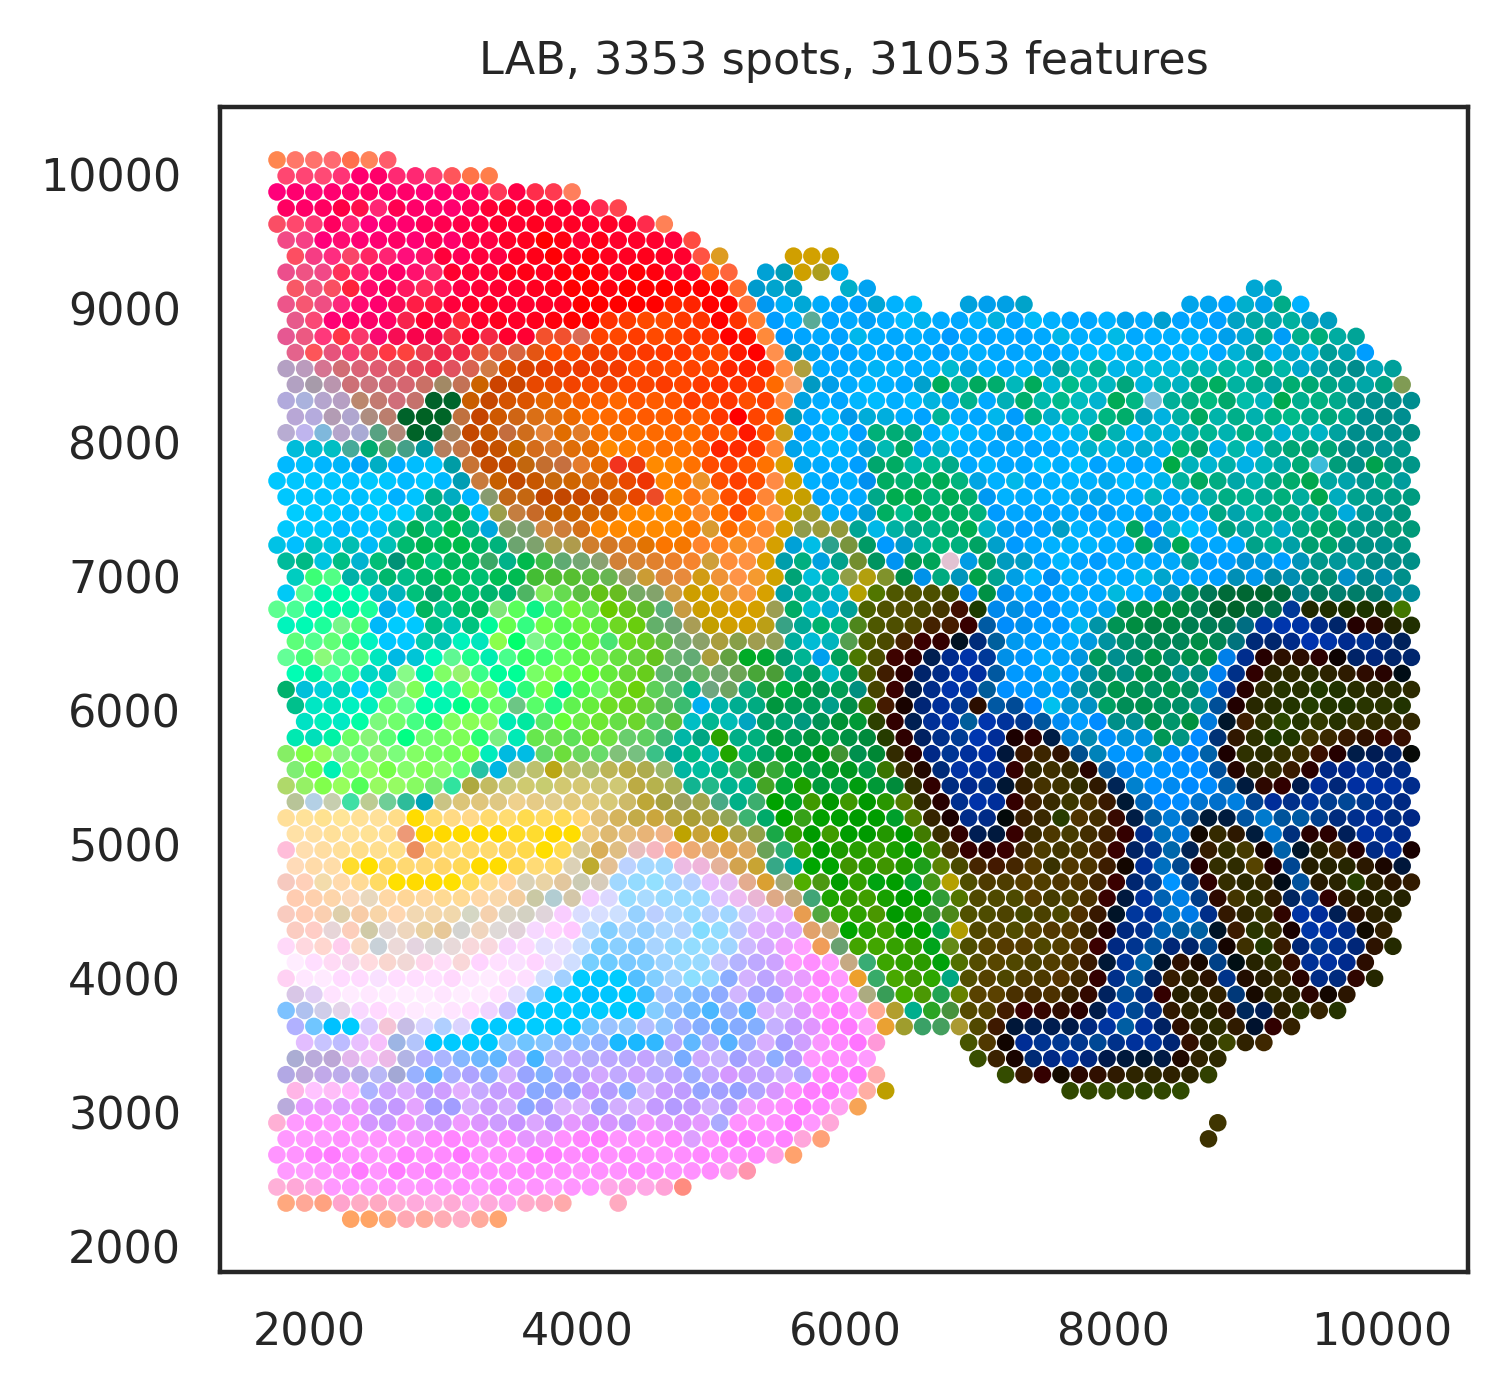
[9]:
# change the marker style to hexagon to fit for 10X Visium
SOView.SOViewer_plot(
    adata = adata, # the data to plot
    save = None, # save the result to specified path or don't save (None)
    embedding_use='X_umap', # which embedding to be used for plot
    dot_size=13, # the marker size of the plot
    marker = 'h' # marker style


)
generating color coding...
1.0 0.0

1.0 0.0

[ ]: